Search This Blog
Friday, October 8, 2010
Dutch Get All Reflexive
I had an interesting discussion with my colleague Gregory today. I was telling him about my network-work, and told him that I was trying to find something about language to pull off. Since his wife is a Dutch language professor and Gregory has been digging deeply into that language, I thought he might have some insights.
He began to tell a tale about reflexive verbs in the Dutch language, and some recent research that has been returned. Apparently, the Dutch language originally had no reflexive verbs (verbs where the subject and direct object are the same, like "I shave myself"). When it appeared, it swept through the country. Originally, it was thought this was due to the publication of the Dutch Bible, and the Dutch people's desire to speak with the patois of the rich.
According to Prof. Jolanda Vanderwal Taylor (Dutch Language, University of Wisconsin - Madison), a recent dissertation by Jennifer Boyce-Hendriks determined that the introduction of reflexive verb was the introduction of German refugees from the south; they brought the concept of reflexivity with them. The Dutch people, for whatever reason, found it an attractive addition to the language, and it rapidly spread. This is backed up by journals, letters and legal documents that are stored in the official archives.
Since this was a pre-media society, the spread had to occur through contact (face-to-face, people hearing the reflexive verb spoken) rather than through mediated means, and thus would have spread like a "wave" rather than a flash.
I constructed a basic wave-like movement over a population space, then recorded Gregory using both a passive and reflexive phrase in Dutch. These two phrases are cross-faded as the wave washes over the population, eventually leading to only a reflexive voice remaining. I'm going to record a part of an interview tomorrow, and hope to include that with the sonification to create a cool audio piece that combines interview, disembodied Dutch phrases and perhaps some drone based coincident generators. This one turned out cool.
Done in Max only because the sound capabilities of NetLogo were horrible, and I wanted the visuals that couldn't come out of something like Nodal.
[ddg]
Edits: Some additional material added. The reference dissertation is "Immigration and linguistic change: A socio-historical linguistic study of the effect of German and southern Dutch immigration on the development of the northern Dutch vernacular in 16th/17th century Holland" by Jennifer Boyce-Hendriks.
Wednesday, October 6, 2010
Rain-to-storage completed!
I'm going to stop here, because adding population (with stressers, birth and death rates and other social issues) is beyond the scope of this exercise. But just watching it run is pretty telling - especially when you use some of the ranges implied by Peterson and Haug.
It's pretty easy to see how extreme drought (.15 multiplier on typical annual rainfall) is devastating to even the most rain-heavy location, and even modest drought (.8 multiplier) makes things very difficult at the low end of the rainfall range. Interesting to watch - and I'll have to throw some population simulation at this some day.
Added note: Tim asked me to touch on cenotes, a feature of the northern Yucatin that allowed access to groundwater through sinkholes. These natural openings provided access to water, so that northern Mayans were not entirely dependent on captured rainwater. However, Classic Mayans in the southern regions were at a higher elevation, and these features were not available. The Peterson/Haug study seems to focus on the southern region - probably for simplicity - and my modeling follows the premises of that study.
[ddg]
Tuesday, October 5, 2010
More Details Revealed
On the plane to SF today, I spent a little time reviewing the information provided by the Peterson and Haug article. A few data points:
- Rainfall varies based on location, from 500 mm/year (19.6 inches) to 4000 mm/year (157.5 inches).
- 90% of the rainfall occurs between June and September.
- City/states such as Tikal had water holding facilities able to support up to 10,000 people for 18 months.
- The typical drought periodicity was around 200 years, but the time of focus (760-910 A.D.) had significant drought period approximately 50 years apart.
- Again, based on location (and particularly in the northern regions), there was little surface water that could be used to support the population.
- The lack of water could be considered an amplifying effect on other behaviors, and thus population stress was likely to be greatly increased during times of drought.
Given this, and in order to simplify, I had to make some basic assumptions (and perform some initial calculations:
- Assuming a daily water consumption of 1 gallon per day, having enough water for a population of 10,000 requires about 300,000 gallons per months, or 5,400,000 gallons of water for an 18 month period.
- Evapotranspiration would have a significant effect on standing water supplies. Without further details, and assuming some attempt at mitigation, we'll assume that 10% of water supply would evaporate every month. This will be a variable that we can adjust if that assumption is proven invalid. (Some information on this retrieved from http://www.eoearth.org/article/Evapotranspiration).
- A cubic foot of storage will hold 7.48 gallons of water (found here). That means our 5400K gallon water storage would take roughly 721925 cubic feet - so we will start with an assumption of roughly 120000 square feet to a depth of 6 feet. This is important, because the size of the "opening" will also (probably) be the collection area.
- One gallon of rain is collected in 231 cubic inches (1.6 s.f. of area to a depth of an inch). Hence, the rainfall collected in a 120000 s.f. collection area is roughly 75000 gallons per inch of rain.
All of this is sort of conjecture, and needs to be modeled up. So I'm going to run off and do that now...
[ddg]
Monday, October 4, 2010
Next Network: Mayan Water Usage
In class, Tim made a passing remark about (as I remember it) the use of water collection systems in Classic Mayan city/states. Since this civilization is both collapsed and well-researched, I thought it would make an interesting area for attempting a network sketch.
In doing some surface digging, there seems to be a debate about the cause of the Mayan collapse; there are a significant number of people that consider drought to have been a major contributor. Thus, combining climatic change with water collection/storage and population statistics seem to be an interesting area for network investigation. At this point, my focus is going to be on information gathered from Peterson and Haug's "Climate and the Collapse of Maya Civilization" (American Scientist, Jul/Aug 2005), retrieved from the Penrose online search and retrieval system.
Obviously, this will have to be a grossly simplified network simulation. However, a few ideas come immediately to mind:
- Climate simulation will be limited to monthly rainfall amounts (although combining this with temperature - and its effect on water use - is tempting). The min/max range will be user selectable.
- Seasonal variations will be sinewave-based, with a larger "multiyear" variant that will simulate extended drought periods and the ability (or lack thereof) of storage systems to compensate. The period length and percentage of effect will be user selectable.
- A variable number of storage systems, along with their storage volumes, will be user input. The amount contained is to act as a buffering agent against drought and seasonal variation.
- The population will have an initial value (in thousand, I'm guessing), along with a variable water usage per-person. This is the hard-line tool for storage depletion.
- Population growth and shrinkage will be based on available water, where birth and death rates will vary based on the availability of water.
A super simplification of climate's effect on a population, but it may produce interesting results. I'm going to do this one in Max, because I think some of the variations will not only produce interesting artifacts (graphs, mostly), but these kinds of variation may provide results that could be used for sonification. Hopefully, I'll have something to post about the results tomorrow!
[ddg]
Sunday, October 3, 2010
The Alpha Dog
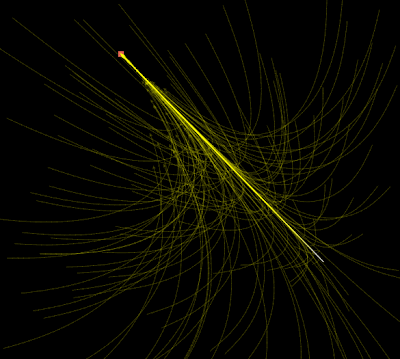
So I started work on sketching up some of my network ideas. I wanted to start with something simple - and something a little biological. So I decided to build a little "alpha dog effect" system in NetLogo. Took most of the day to learn the environment, but the results are pretty cool.
There are only two user controls: number of followers, and the amount of alpha-deference. When alpha-deference (the deference to the alpha attack dog) is low, all of the "follower" dogs will head more-or-less straight for the goal. When the alpha-deference is high, the followers will run to the alpha, then follow it to the goal. Points in between exhibit interesting results, where the dogs may precede the alpha, but will slow down their advance until the alpha dog is closer - eventually allowing it to share in the first strike.
NetLogo is a pretty neat environment, but the documentation is a little rough. Luckily, I know enough programming to be able to make sense of the NetLogo Dictionary (the real location for goodies), but I'm not sure how less adept programmers will fare when things have to be learned really, really quick.
[ddg]
Note: This was not a scientific study - rather, it was a test case for NetLogo using anecdotal concepts for "alpha dog" behavior.
Subscribe to:
Posts (Atom)